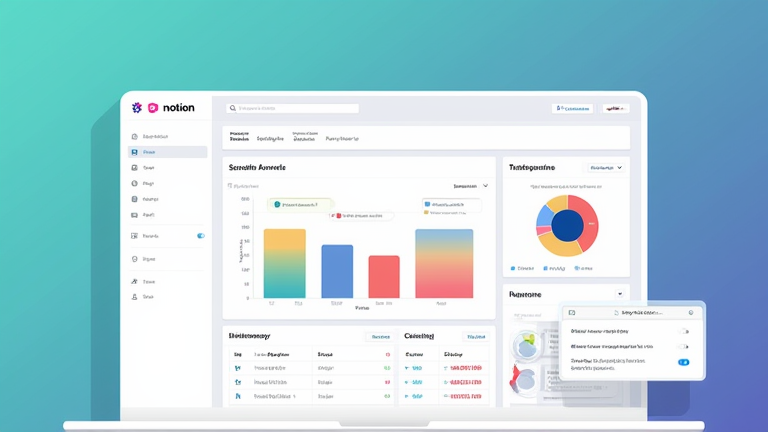
TL;DR: In 10 minutes, you can build a live personal finance dashboard in Notion using a single database, linked views, and rollup formulas—no coding required. This guide walks you through creating a transaction tracker, monthly summaries, and spending categories that auto-update.
Step 1: Create the Master Transaction Database
Open a new Notion page, type /database, and select “Table – Inline.” Name it “Transactions.” Add these columns (types in parentheses): Date (Date), Description (Text), Category (Select – e.g., Food, Rent, Transport, Fun, Income), Amount (Number – use negative for expenses, positive for income), and Account (Select – e.g., Cash, Credit Card). Don’t overthink; you can add more later.
If you want to dig deeper, check out our guide on Reddit Launches New Subreddit Layout Features for Community .
Step 2: Enter Sample Data (or Import)
Quickly add 5–10 rows so your dashboard isn’t empty. For each transaction, set the date, pick a category, and type the amount (e.g., -45.00 for groceries, +2500 for salary). If you have a CSV from your bank, use Notion’s “Import” feature (top-right of the database) to paste it directly—just map columns to match.
Step 3: Build Linked Views for Overview
Type /linked view of database on the same page, select your “Transactions” database. Repeat this three times. Now customize each view:
- View 1 – “All Transactions”: Keep as a table, sort by Date descending.
- View 2 – “Monthly Summary”: Switch to “Board” grouped by Category. Then, click the “…” on the view, select “Group by,” and choose “Month” as a secondary group (or use a “Rollup” property—see tip below).
- View 3 – “Income vs. Expense”: Switch to “Calendar” grouped by Date, then filter Amount to show only negatives (expenses) or positives (income) using “Filter” → “Amount” → “is less than 0.”
Step 4: Add Rollup Formulas for Totals
Back in the original “Transactions” database, add two “Rollup” properties: Total Expenses (rollup of Amount, where category is not Income) and Total Income (rollup of Amount, where category = Income). For each rollup, set “Calculate” to Sum. This auto-updates as you add rows.
Step 5: Create the Dashboard Header
At the top of your page, add a /callout with a “💰” emoji. Inside, type @Total Expenses and @Total Income (use the “@” key to link those rollup properties). Then add a formula property Net Worth (Formula: Total Income + Total Expenses). Display it in the callout too.
Step 6: Add Visual Charts (Free Workaround)
Notion doesn’t have native charts, but you can copy the rollup numbers into a simple bar chart using “/embed” and a free chart URL (like QuickChart). Alternatively, use the “Board” view by category—the card counts visually show spending proportions. For a 10-minute build, the board view is enough.
Tips for Speed & Accuracy
Use “Templates” in the database to pre-fill common categories. Set a default filter on “Monthly Summary” to show only the current month (Filter → Date → is in the
Leave a Reply